Prometheus 是一个最初在SoundCloud上构建的开源系统监视和警报工具包。
Grafana 是一个跨平台的开源的度量分析和可视化工具,可以通过将采集的数据查询然后可视化的展示,并及时通知。
Windows采集器(wmi_exporter)
要获取服务器运行时的参数,比如当前的CPU负载、内存消耗、硬盘使用、网络IO等等,就可以在服务器上运行一个node_exporter,它能把这些参数收集好,并且暴露出一个HTTP接口以便你访问查询。
- 下载采集器
从wmi_exporter下载 - 安装
直接双击安装即可。
Windows默认9182端口。 - 验证
访问http://127.0.0.1:9182/metrics
显示以下数据,数据采集器安装成功。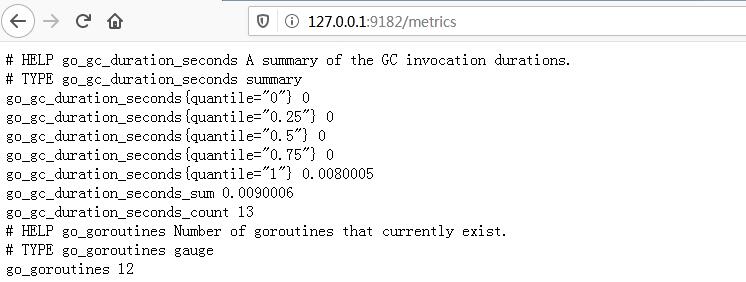
Prometheus
- 下载
从Prometheus下载 配置
打开prometheus.yml1
2
3
4
5
6
7
8
9
10
11
12
13
14
15
16
17
18
19
20
21
22
23
24
25
26
27
28
29# my global config
global:
scrape_interval: 5s # Set the scrape interval to every 15 seconds. Default is every 1 minute.
evaluation_interval: 5s # Evaluate rules every 15 seconds. The default is every 1 minute.
# scrape_timeout is set to the global default (10s).
# Alertmanager configuration
alerting:
alertmanagers:
- static_configs:
- targets:
# - alertmanager:9093
# Load rules once and periodically evaluate them according to the global 'evaluation_interval'.
rule_files:
# - "first_rules.yml"
# - "second_rules.yml"
# A scrape configuration containing exactly one endpoint to scrape:
# Here it's Prometheus itself.
scrape_configs:
# The job name is added as a label `job=<job_name>` to any timeseries scraped from this config.
- job_name: 'prometheus'
# metrics_path defaults to '/metrics'
# scheme defaults to 'http'.
static_configs:
- targets: ['localhost:9182']运行(将默认端口9090改为8091)
1
prometheus.exe --config.file=prometheus.yml --web.listen-address=:8091 &
验证
访问http://127.0.0.1:8091/
目标列表中有你本地的机器,说明Prometheus已经成功监控到本地。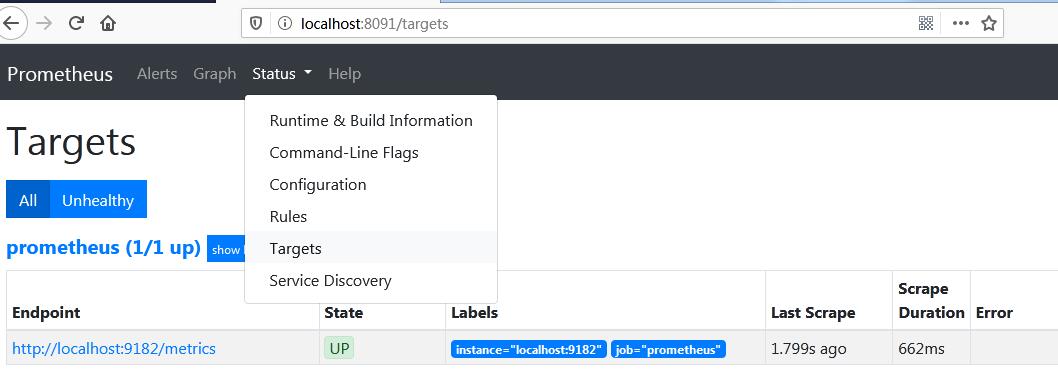
Grafana
- 下载
从Grafana下载 启动
双击安装即可。 进行到安装bin目录下:双击grafana-server.exe启动
访问http://127.0.0.1:3000
默认账号/密码:admin/admin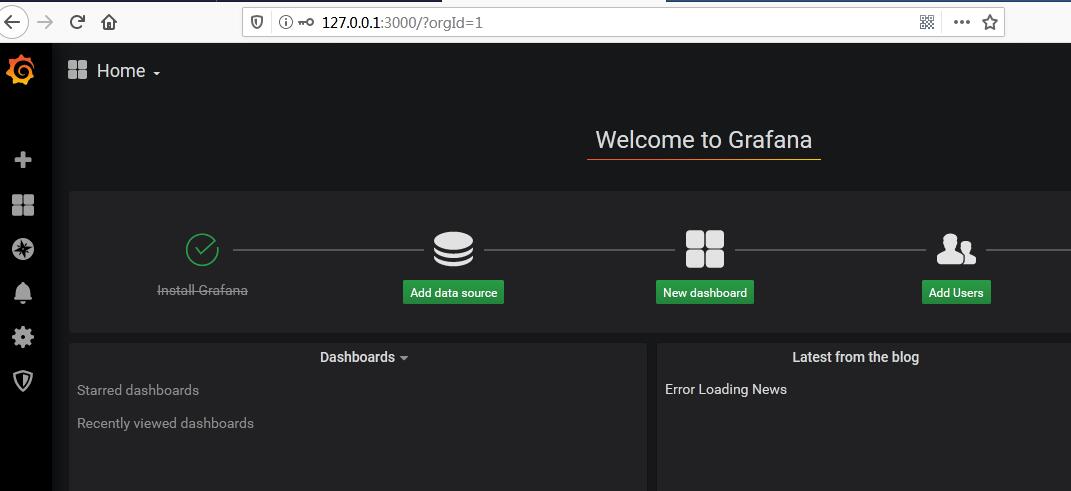
配置Prometheus数据源
从刚才配置好的prometheus那里获取本地性能数据并展示。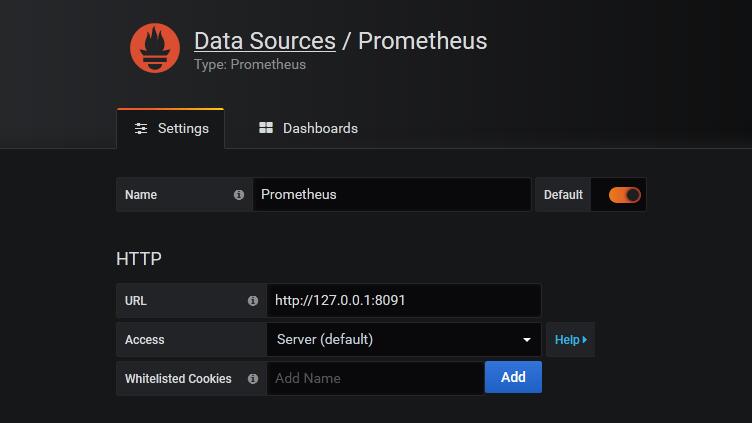
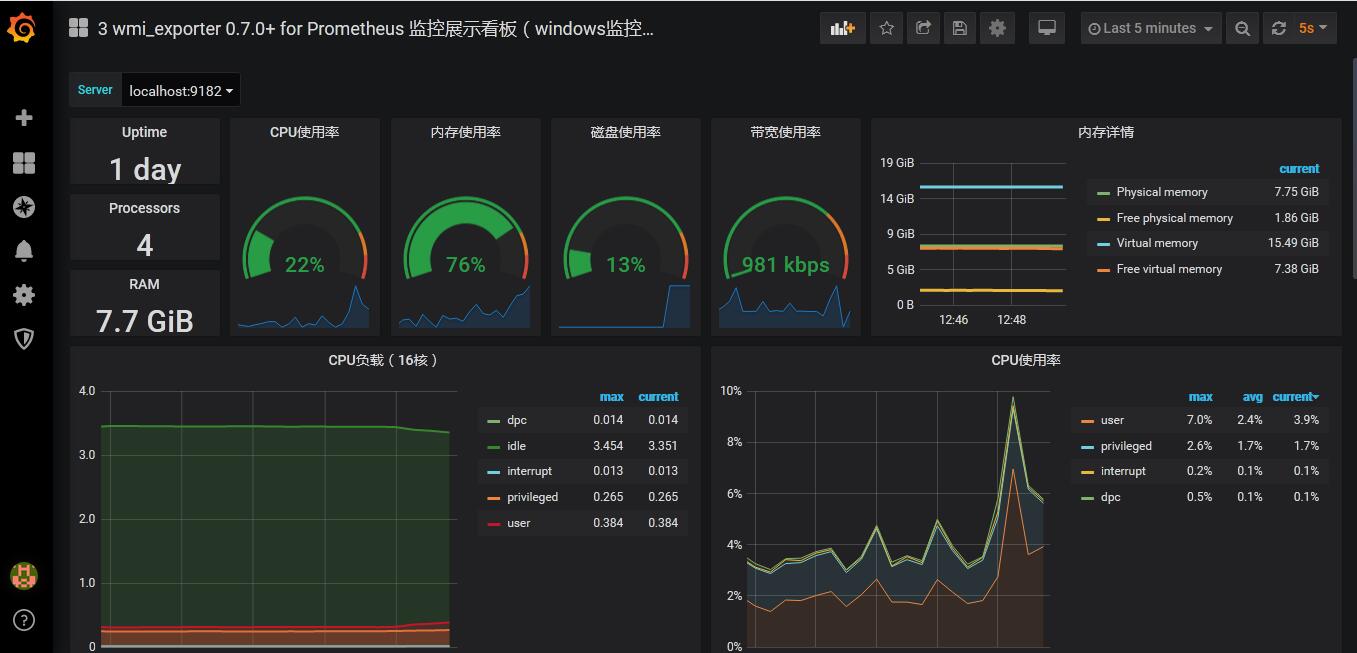
搭建Prometheus仪表盘
Import Dashboard: 10467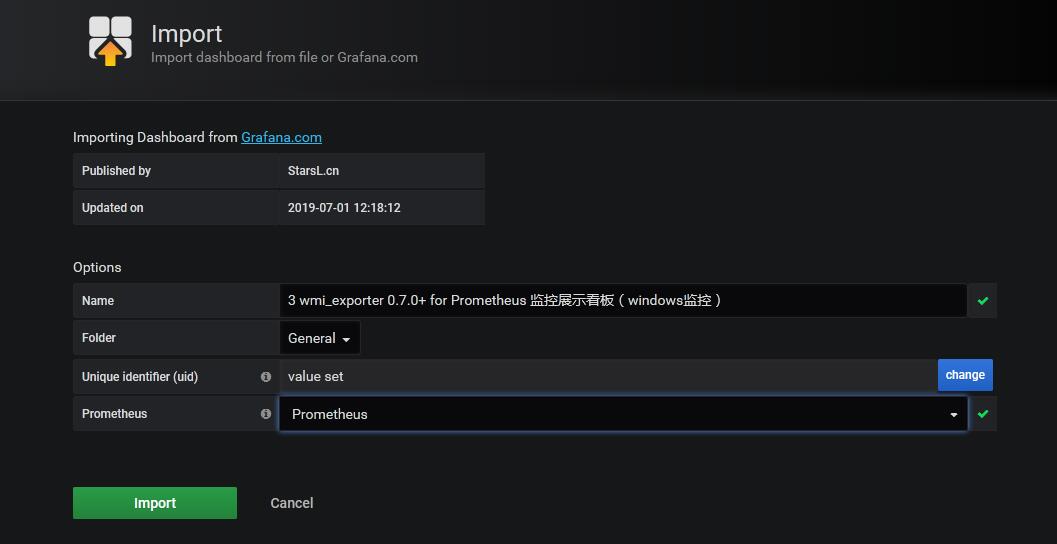
最终显示如下: