对于测试来说,更关注于功能(接口或UI)测试的覆盖率,一样也可以通过Jacoco来实现。
我们需要这两个jar: jacocoagent.jar和jacococli.jar。
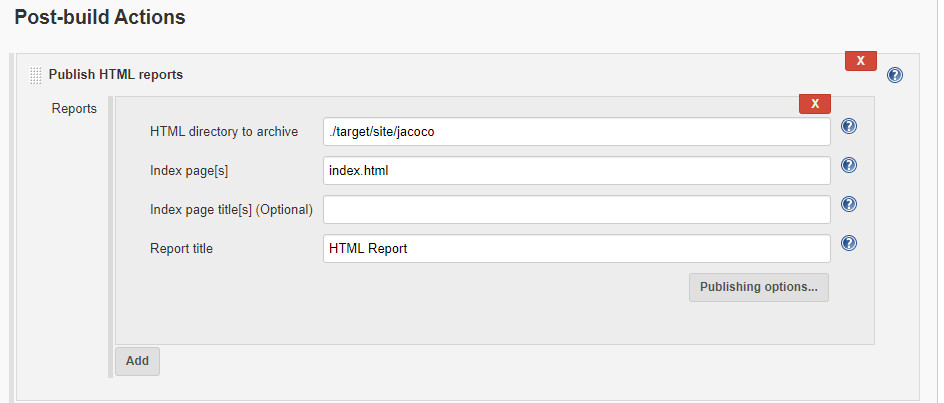
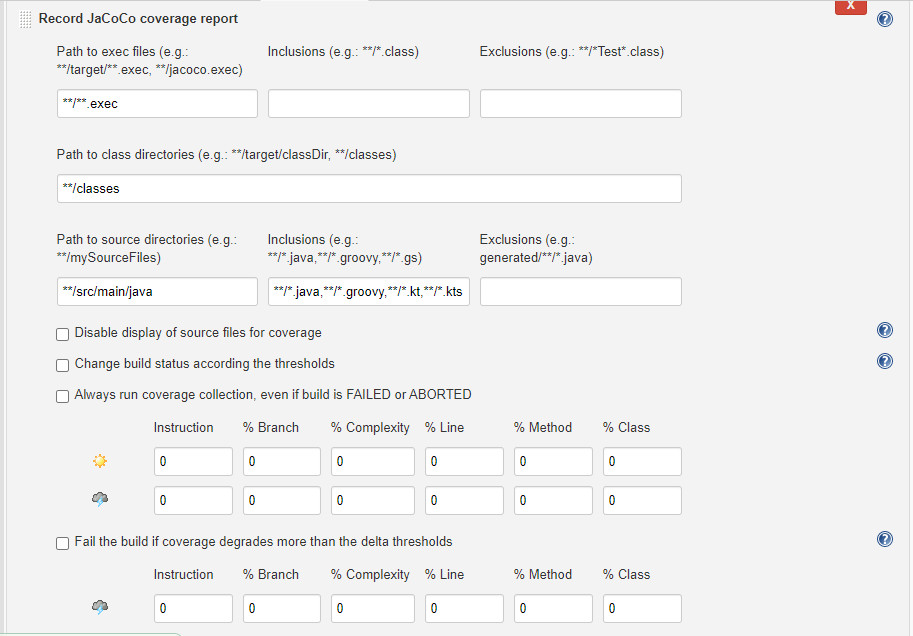
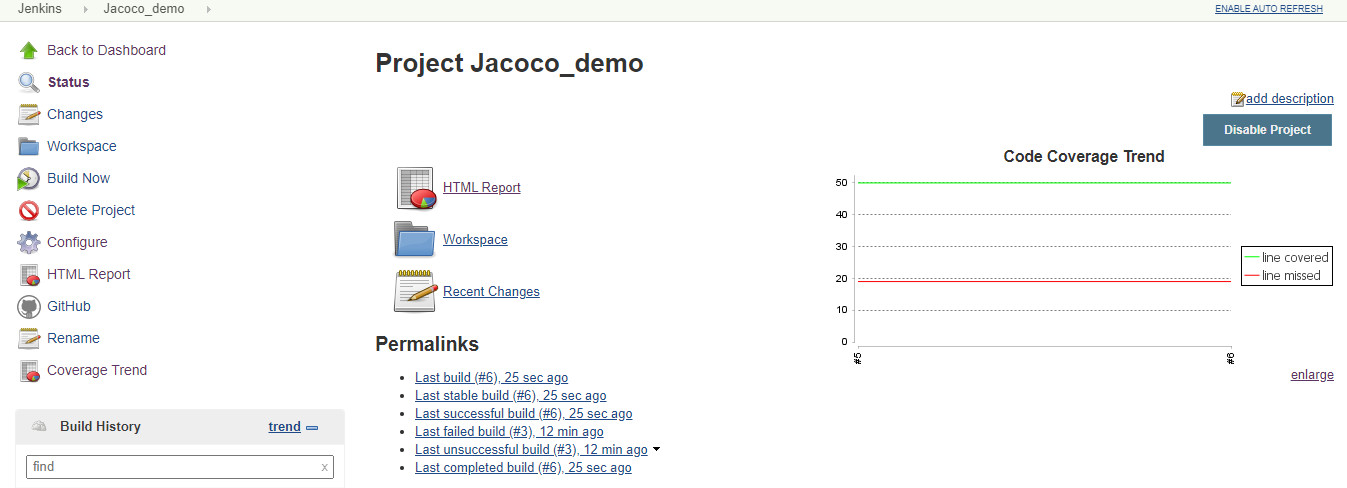
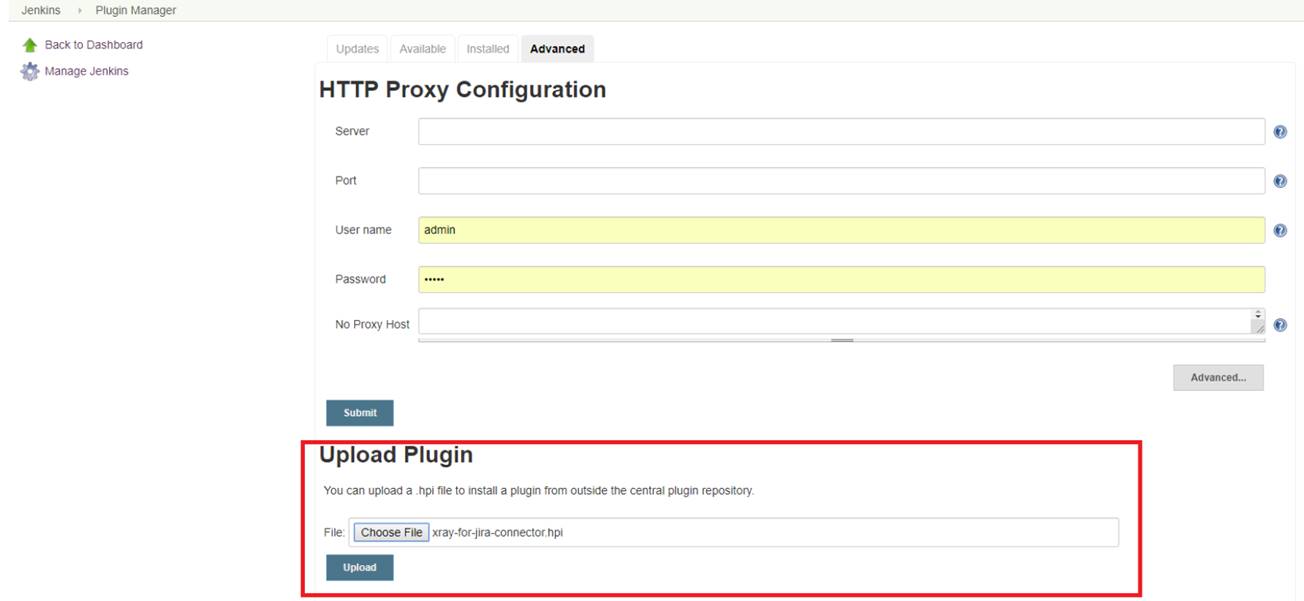
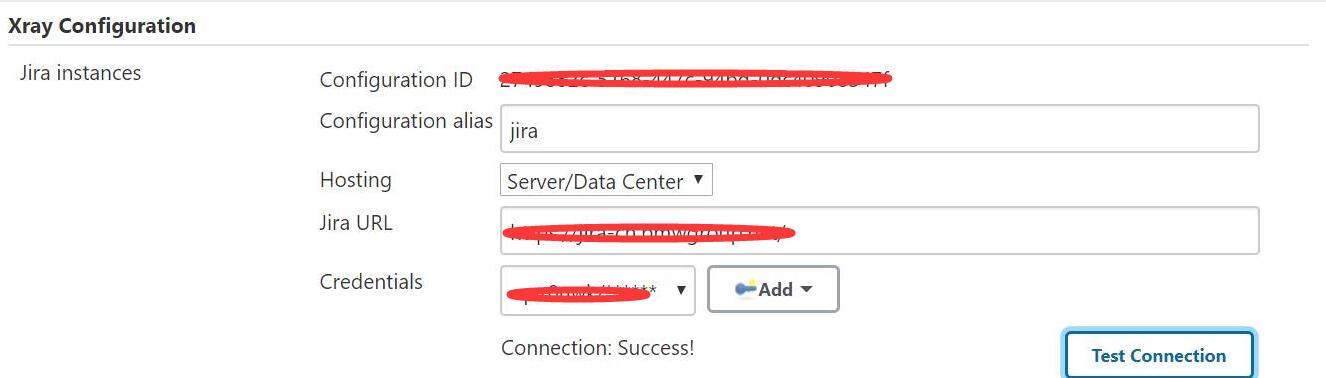
一样是和Git,Jenkins集成,说一下思路
同样
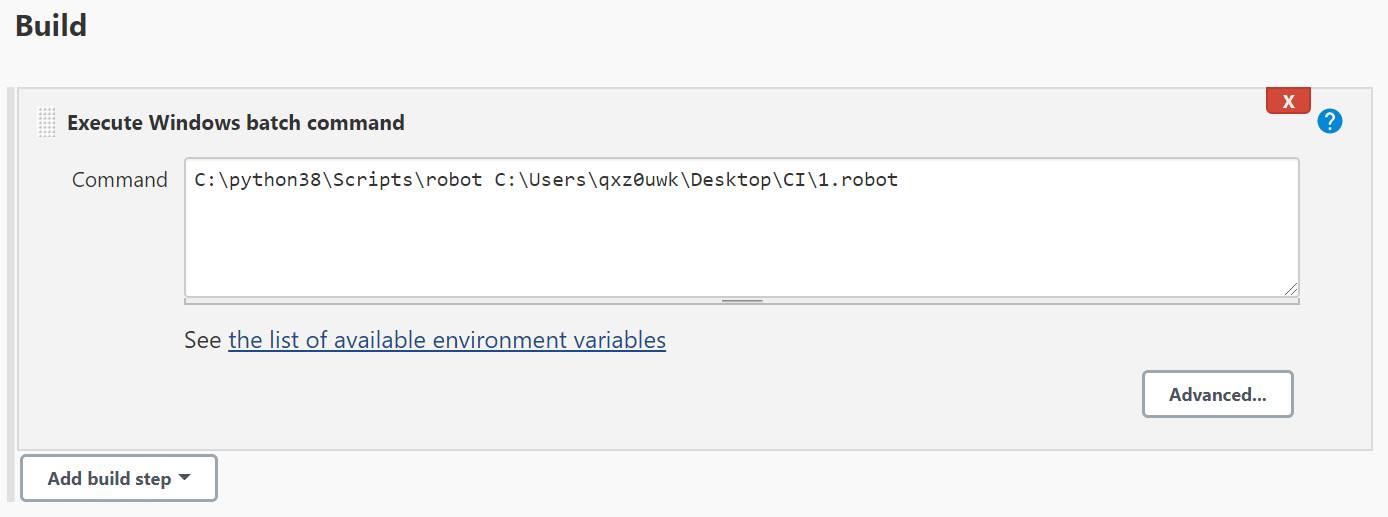
mvn install,打包生成jar包项目启动的时候,配置jacoco agent
1
java -javaagent:/jacocoagent.jar=includes=*,output=tcpserver,address=localhost,port=11111 -jar ./target/project-0.0.1-SNAPSHOT.jar
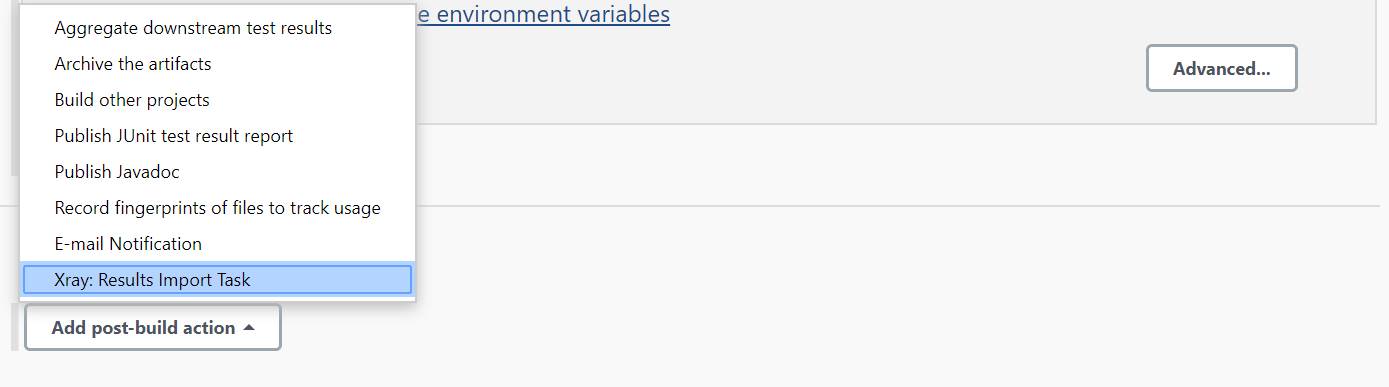
启动后,生成报告
1
java -jar jacococli.jar dump --address localhost --port 11111 --destfile ./jacoco-demo.exec
1
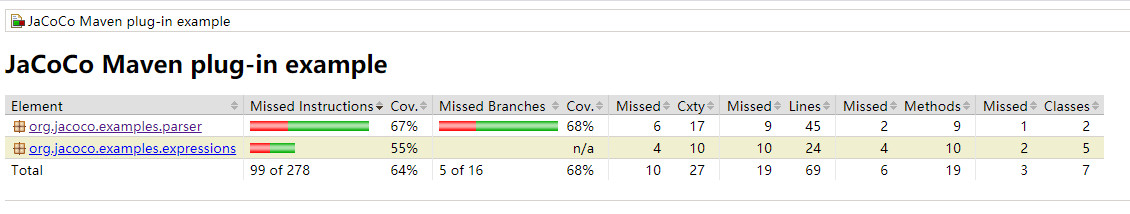
java -jar jacococli.jar report ./jacoco-demo.exec --classfiles ./target/classes --html ./report
没有做任何测试,覆盖率极低。
做一些测试之后,生成报告
反映出实时的测试覆盖率。
以上只是简单例子,也可以在Tomcat里配置。