在性能测试的过程中,要监控的地方应该就是以下部分:
- 操作系统
- 中间件
- Code
- DB
- 网络
这5部分来说,主要的瓶颈可能多是操作系统、代码和DB。会在下面把这两个部分说明,操作系统基于Linux,代码基于Java,DB视情况而定。
CPU
CPU监控的关键指标做一个大概的说明:
运行队列
正在执行和等待CPU处理的任务的总和,称为运行队列。运行队列越长,说明排队等待的任务越多,响应越慢。
Notes:运行队列长度最大不要超过当前内核数的3倍。
Another common system statistic is that of load average. The load on a system is the total amount of running and runnable process. For example, if two processes were running and three were available to run, the system’s load would be five. The load average is the amount of load over a given amount of time. Typically, the load average is taken over 1 minute, 5 minutes, and 15 minutes. This enables you to see how the load changes over time.
上下文切换
To create the illusion that a given single processor runs multiple tasks simultaneously, the Linux kernel constantly switches between different processes. The switch between different processes is called a context switch, because when it happens, the CPU saves all the context information from the old process and retrieves all the context information for the new process.
是CPU在不同进程间按时间片轮换,交互性强的需要高优先级,交互性弱的需要低优先级。在linux系统中,有两种优先级:普通优先级和实时优先级。上下文切换不可避免,如果可能最好减少上下文切换。
中断
一般来自于外部硬件中断,中断也是不可避免的。中断就会有上下文切换,但是上正文切换并不都是中断造成的。
性能测试不需要特别关心内核的问题(中断、上下文切换),而是关注有时因程序写的不好造成的频繁切换(不正常切换)。
资源利用率
CPU utilization is a straightforward concept. At any given time, the CPU can be doing one of seven things.
First, it can be idle, which means that the processor is not actually doing any work and is waiting for something to do. This is “idle“ time.
Second, the CPU can be running user code, which is specified as “user“ time.
Third, the CPU can be executing code in the Linux kernel on behalf of the application code. This is “system“ time.
Fourth, the CPU can be executing user code that has been “nice”ed or set to run at a lower priority than normal processes. (切换线程优先级时消耗的时间)
Fifth, the CPU can be in iowait, which mean the system is spending its time waiting for I/O (such as disk or network) to complete.
Sixth, the CPU can be in irq state, which means it is in high-priority kernel code handling a hardware interrupt.
Finally, the CPU can be in softirq mode, which means it is executing kernel code that was also triggered by an interrupt, but it is running at a lower priority (the bottom-half code). This can happen when a device interrupt occurs, but the kernel needs to do some work with it before it is ready to hand it over to user space (for example, with a network packet).
通常我们只关注:idle, user, system, (+wa)。
在正常情况下,用户态和系统态的CUP消耗比率是7:3.
Memory
Swap
All systems have a fixed amount of physical memory in the form of RAM chips. The Linux kernel allows applications to run even if they require more memory than available with the physical memory. The Linux kernel uses the hard drive as a temporary memory. This hard drive space is called swap space.
交换空间大小一般是实际物理内存大小的2倍。
Although swap is an excellent way to allow processes to run, it is terribly slow. It can be up to 1,000 times slower for an application to use swap rather than physical memory.
Cache & Buffer
Cache(读缓存): If your system has much more physical memory than required by your applications, Linux will cache recently used files in physical memory so that subsequent accesses to that file do not require an access to the hard drive.
Buffer(写缓存): To further optimize applications, Linux sets aside memory to use for data that needs to be written to disk. These set-asides are called buffers. If an application has to write something to the disk, which would usually take a long time, Linux lets the application continue immediately but saves the file data into a memory buffer. At some point in the future, the buffer is flushed to disk, but the application can continue immediately.
程序内存申请整个流程
程序申请操作的不是直接要物理内存地址,而是一个虚拟的地址表,跟实际内存映射。
例子:
- 实际物理内存2G, 已经占用1.5G,剩余0.5G
- 程序申请1G
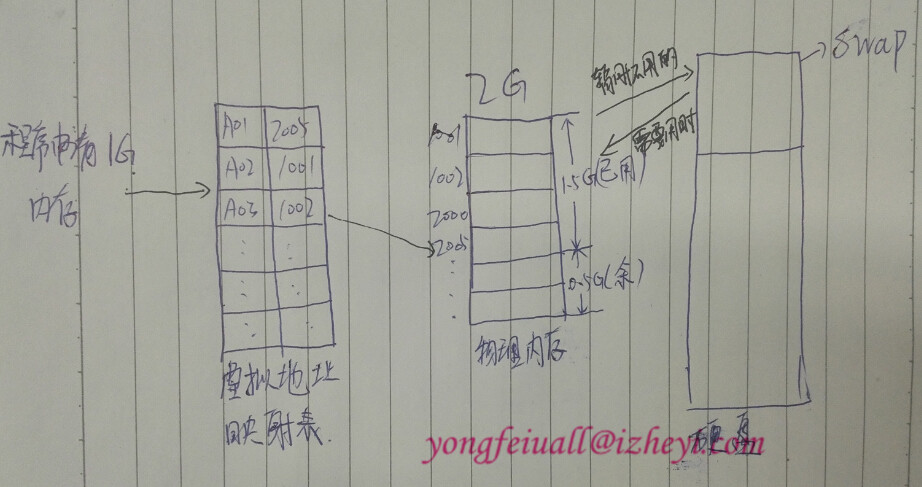
请与文章末尾的Spotlight可视化界面进行参照学习,更容易理解。
Disk I/O
这块的内容在内存的流程中已经提及,Disk的主要工作就是读和写,提高性能的主要手段也就是减少磁盘的访问次数。
iostat 命令用来监视系统输入/输出设备负载,如果没有安装需要自己安装。
安装时可以执行如下命令1
yum install sysstat
命令使用1
2
3
4
5
6
7
8
9
10
11[root@Automation ~]# iostat
Linux 2.6.32-573.el6.x86_64 (Automation) 2015年12月10日 _x86_64_ (2 CPU)
avg-cpu: %user %nice %system %iowait %steal %idle
0.02 0.02 0.08 0.03 0.00 99.85
Device: tps Blk_read/s Blk_wrtn/s Blk_read Blk_wrtn
sda 0.63 15.39 14.25 2560734 2370826
scd0 0.00 0.00 0.00 360 0
dm-0 2.05 15.33 14.25 2551410 2370808
dm-1 0.00 0.02 0.00 2600 0
Network
考虑的是带宽。主要工具:iptraf,如果没安装需要自己安装。1
yum install -y iptraf
还有netstat, ifconfig====
监控工具
这里主要介绍两个Linux自带的工具:
vmstat
1 | [root@Automation ~]# vmstat 2 |
Notes:
r 表示运行队列(就是说多少个进程真的分配到CPU),我测试的服务器目前CPU比较空闲,没什么程序在跑,当这个值超过了CPU数目,就会出现CPU瓶颈了。这个也和top的负载有关系,一般负载超过了3就比较高,超过了5就高,超过了10就不正常了,服务器的状态很危险。top的负载类似每秒的运行队列。如果运行队列过大,表示你的CPU很繁忙,一般会造成CPU使用率很高。
b 表示阻塞的进程,这个不多说,进程阻塞,大家懂的。
swpd 虚拟内存已使用的大小,如果大于0,表示你的机器物理内存不足了,如果不是程序内存泄露的原因,那么你该升级内存了或者把耗内存的任务迁移到其他机器。
free 空闲的物理内存的大小,我的机器内存总共8G,剩余3415M。
buff Linux/Unix系统是用来存储,目录里面有什么内容,权限等的缓存,我本机大概占用300多M
cache cache直接用来记忆我们打开的文件,给文件做缓冲,(这里是Linux/Unix的聪明之处,把空闲的物理内存的一部分拿来做文件和目录的缓存,是为了提高程序执行的性能,当程序使用内存时,buffer/cached会很快地被使用。)
si 每秒从磁盘读入虚拟内存的大小,如果这个值大于0,表示物理内存不够用或者内存泄露了,要查找耗内存进程解决掉。我的机器内存充裕,一切正常。
so 每秒虚拟内存写入磁盘的大小,如果这个值大于0,同上。
bi 块设备每秒接收的块数量,这里的块设备是指系统上所有的磁盘和其他块设备,默认块大小是1024byte,我本机上没什么IO操作,所以一直是0。
bo 块设备每秒发送的块数量,例如我们读取文件,bo就要大于0。bi和bo一般都要接近0,不然就是IO过于频繁,需要调整。
in 每秒CPU的中断次数,包括时间中断
cs 每秒上下文切换次数,例如我们调用系统函数,就要进行上下文切换,线程的切换,也要进程上下文切换,这个值要越小越好,太大了,要考虑调低线程或者进程的数目,例如在apache和nginx这种web服务器中,我们一般做性能测试时会进行几千并发甚至几万并发的测试,选择web服务器的进程可以由进程或者线程的峰值一直下调,压测,直到cs到一个比较小的值,这个进程和线程数就是比较合适的值了。系统调用也是,每次调用系统函数,我们的代码就会进入内核空间,导致上下文切换,这个是很耗资源,也要尽量避免频繁调用系统函数。上下文切换次数过多表示你的CPU大部分浪费在上下文切换,导致CPU干正经事的时间少了,CPU没有充分利用,是不可取的。
us 用户CPU时间。
sy 系统CPU时间,如果太高,表示系统调用时间长,例如是IO操作频繁。
id 空闲 CPU时间,一般来说,id + us + sy = 100,一般我认为id是空闲CPU使用率,us是用户CPU使用率,sy是系统CPU使用率。
wa 等待IO CPU时间。
top
top很消耗资源,相当于任务管理器,不建议使用。
在top信息里,也可以看到运行队列长度的信息,只不过top里显示的是一段时间内的平均值:1
2
3
4
5
6
7
8
9
10
11
12[root@Automation ~]# top
top - 09:39:58 up 21:13, 1 user, load average: 0.00, 0.00, 0.00
Tasks: 147 total, 1 running, 146 sleeping, 0 stopped, 0 zombie
Cpu(s): 0.0%us, 0.0%sy, 0.0%ni,100.0%id, 0.0%wa, 0.0%hi, 0.0%si, 0.0%st
Mem: 3389988k total, 1705472k used, 1684516k free, 124564k buffers
Swap: 3522556k total, 0k used, 3522556k free, 992336k cached
PID USER PR NI VIRT RES SHR S %CPU %MEM TIME+ COMMAND
2649 root 20 0 2286m 295m 12m S 0.3 8.9 2:55.70 java
18382 root 20 0 15032 1228 916 R 0.3 0.0 0:00.01 top
1 root 20 0 19356 1528 1220 S 0.0 0.0 0:01.73 init
2 root 20 0 0 0 0 S 0.0 0.0 0:00.00 kthreadd
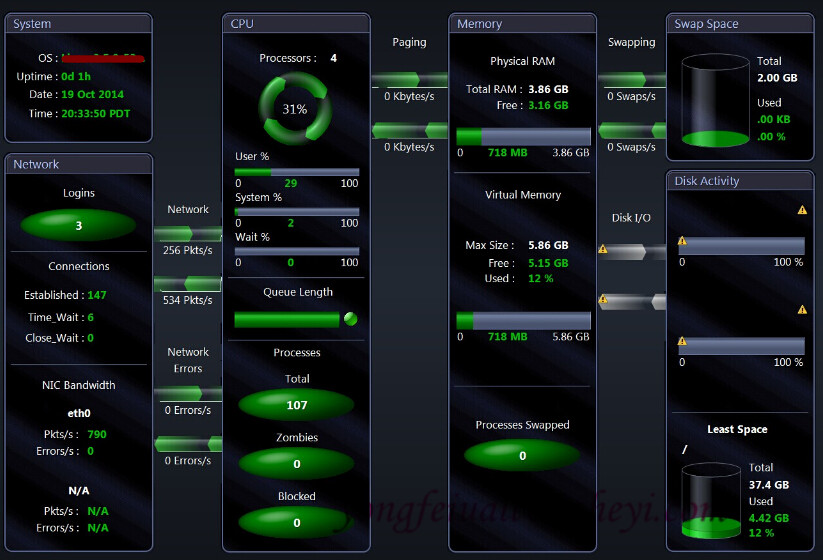
Notes: 还有其他的Linux性能监控工具,比如Spotlight,商业工具,可视化的界面,显示信息包括:操作系统、网络、CPU、内存、磁盘。