Jmeter原生的监控确实是丑了点,且很难实时的压测过程中的性能状态,用下面的方式来代替原生的监控展示。
InfluxDB来存Jmeter运行数据,用Grafana来展示数据。Jmeter引入Backend Listener,压测的过程中实时把统计数据发送到InfluxDB中,通过Grafana可视化的展示出来。
InfluxDB
一个时序数据库,不做详细说明,可参见官网InfluxDB
从官网下载
修改配置文件,influxdb.conf
1
2
3
4
5
6
7
8
9
10
11
12
13
14
15
16
17
18
19
20
21
22
23
24
25
26
27
28
29
30
31
[meta]
# Where the metadata/raft database is stored
dir = "C:/influxdb/meta"
# Automatically create a default retention policy when creating a database.
# retention-autocreate = true
# If log messages are printed for the meta service
# logging-enabled = true
############################
[data]
# The directory where the TSM storage engine stores TSM files.
dir = "C:/influxdb/data"
# The directory where the TSM storage engine stores WAL files.
wal-dir = "C:/influxdb/wal"
############################
[http]
# Determines whether HTTP endpoint is enabled.
enabled = true
# Determines whether the Flux query endpoint is enabled.
# flux-enabled = false
# Determines whether the Flux query logging is enabled.
# flux-log-enabled = false
# The bind address used by the HTTP service.
bind-address = ":8086"
创建相应Folder: data, meta, wal
双击influxd.exe,运行influxDB
1
2
3
4
5
6
7
8
9
10
8888888 .d888 888 8888888b. 888888b.
888 d88P" 888 888 "Y88b 888 "88b
888 888 888 888 888 888 .88P
888 88888b. 888888 888 888 888 888 888 888 888 8888888K.
888 888 "88b 888 888 888 888 Y8bd8P' 888 888 888 "Y88b
888 888 888 888 888 888 888 X88K 888 888 888 888
888 888 888 888 888 Y88b 888 .d8""8b. 888 .d88P 888 d88P
8888888 888 888 888 888 "Y88888 888 888 8888888P" 8888888P"
2020-06-23T06:34:00.421889Z info InfluxDB starting {"log_id": "0NZyzDPG000", "version": "1.8.0", "branch": "1.8", "commit": "781490de48220d7695a05c29e5a36f550a4568f5"}
Jmeter
在InfluxDB创建DB
1
2
3
4
5
6
7
8
9
Connected to http://localhost:8086 version 1.8.0
InfluxDB shell version: 1.8.0
> create database jmeter
> show databases
name: databases
name
----
_internal
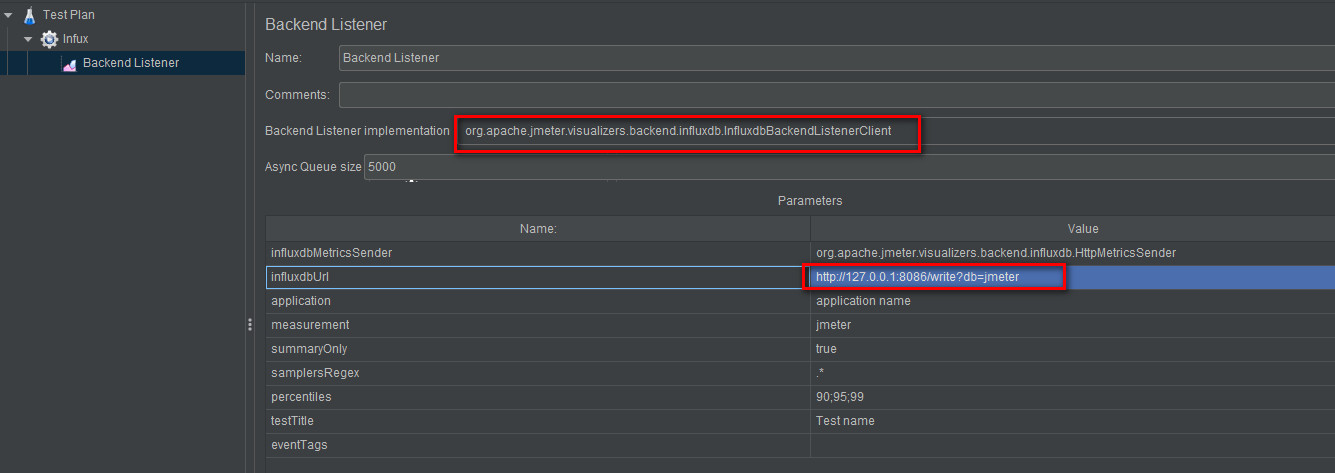
jmeter配置 Jmeter Backend Listerner

Grafana
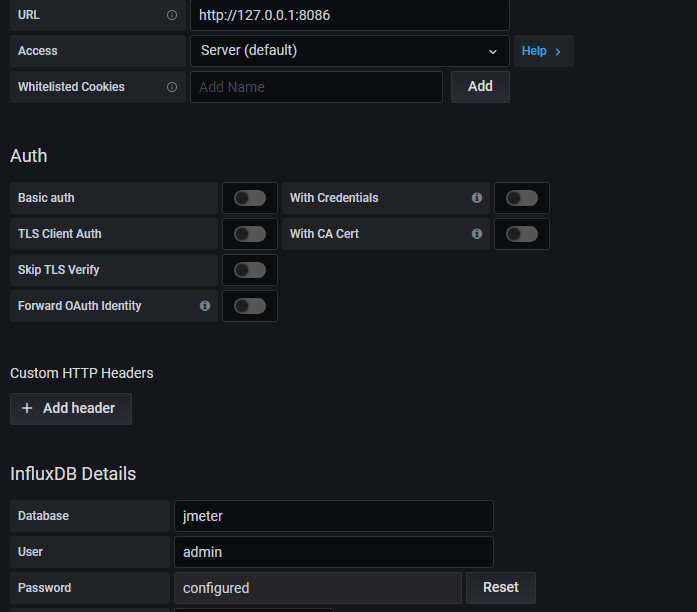
配置数据源

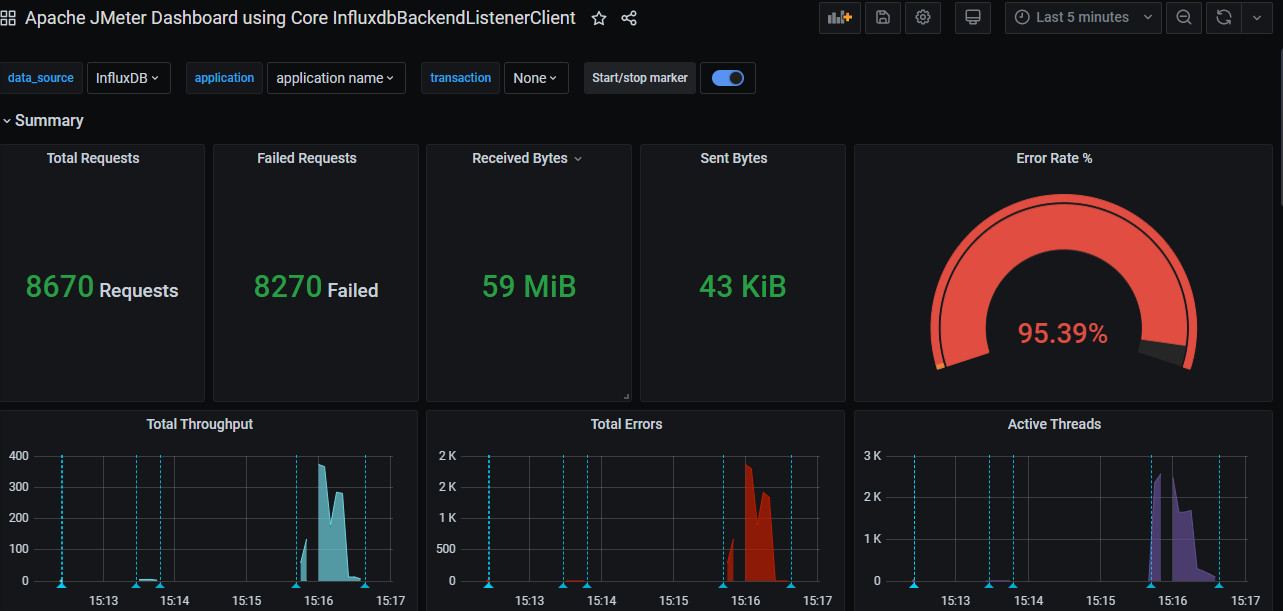
搭建Dashboard
Import Dashboard: 5496
Verify
运行Jmeter脚本,查看数据展示:


